(Solved): Using the standard costing method and the template shown in Table 1.2, produce a basic account sheet ...
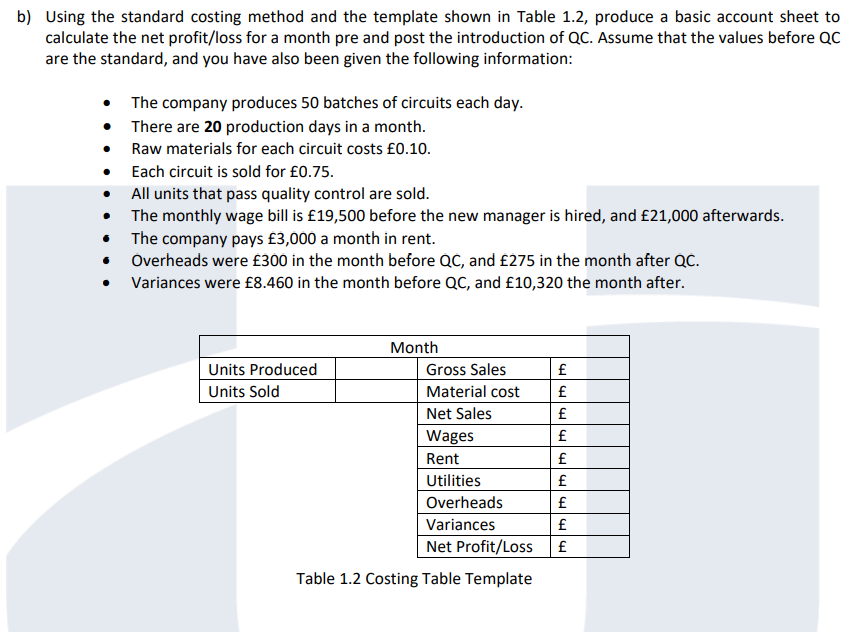
Using the standard costing method and the template shown in Table 1.2, produce a basic account sheet to calculate the net profit/loss for a month pre and post the introduction of QC. Assume that the values before QC are the standard, and you have also been given the following information: • The company produces 50 batches of circuits each day. • There are 20 production days in a month. • Raw materials for each circuit costs £0.10. • Each circuit is sold for £0.75. • All units that pass quality control are sold. • The monthly wage bill is £19,500 before the new manager is hired, and £21,000 afterwards. • The company pays £3,000 a month in rent. • Overheads were £300 in the month before QC, and £275 in the month after QC. • Variances were £8.460 in the month before QC, and £10,320 the month after. b) Using the standard costing method and the template shown in Table 1.2, produce a basic account sheet to calculate the net profit/loss for a month pre and post the introduction of QC. Assume that the values before QC are the standard, and you have also been given the following information: - The company produces 50 batches of circuits each day. - There are \( \mathbf{2 0} \) production days in a month. - Raw materials for each circuit costs \( £ 0.10 \). - Each circuit is sold for \( £ 0.75 \). - All units that pass quality control are sold. - The monthly wage bill is \( £ 19,500 \) before the new manager is hired, and \( £ 21,000 \) afterwards. - The company pays \( £ 3,000 \) a month in rent. - Overheads were \( £ 300 \) in the month before QC, and \( £ 275 \) in the month after QC. - Variances were \( £ 8.460 \) in the month before QC, and \( £ 10,320 \) the month after. Table 1.2 Costing Table Template