Home /
Expert Answers /
Chemistry /
values-along-the-x-axis-146-kj-480-mathrm-kj-etc-are-the-amounts-of-energy-th-pa608
(Solved): values along the \( x \)-axis (146 kJ, \( 480 \mathrm{~kJ} \), etc.) are the amounts of energy th ...
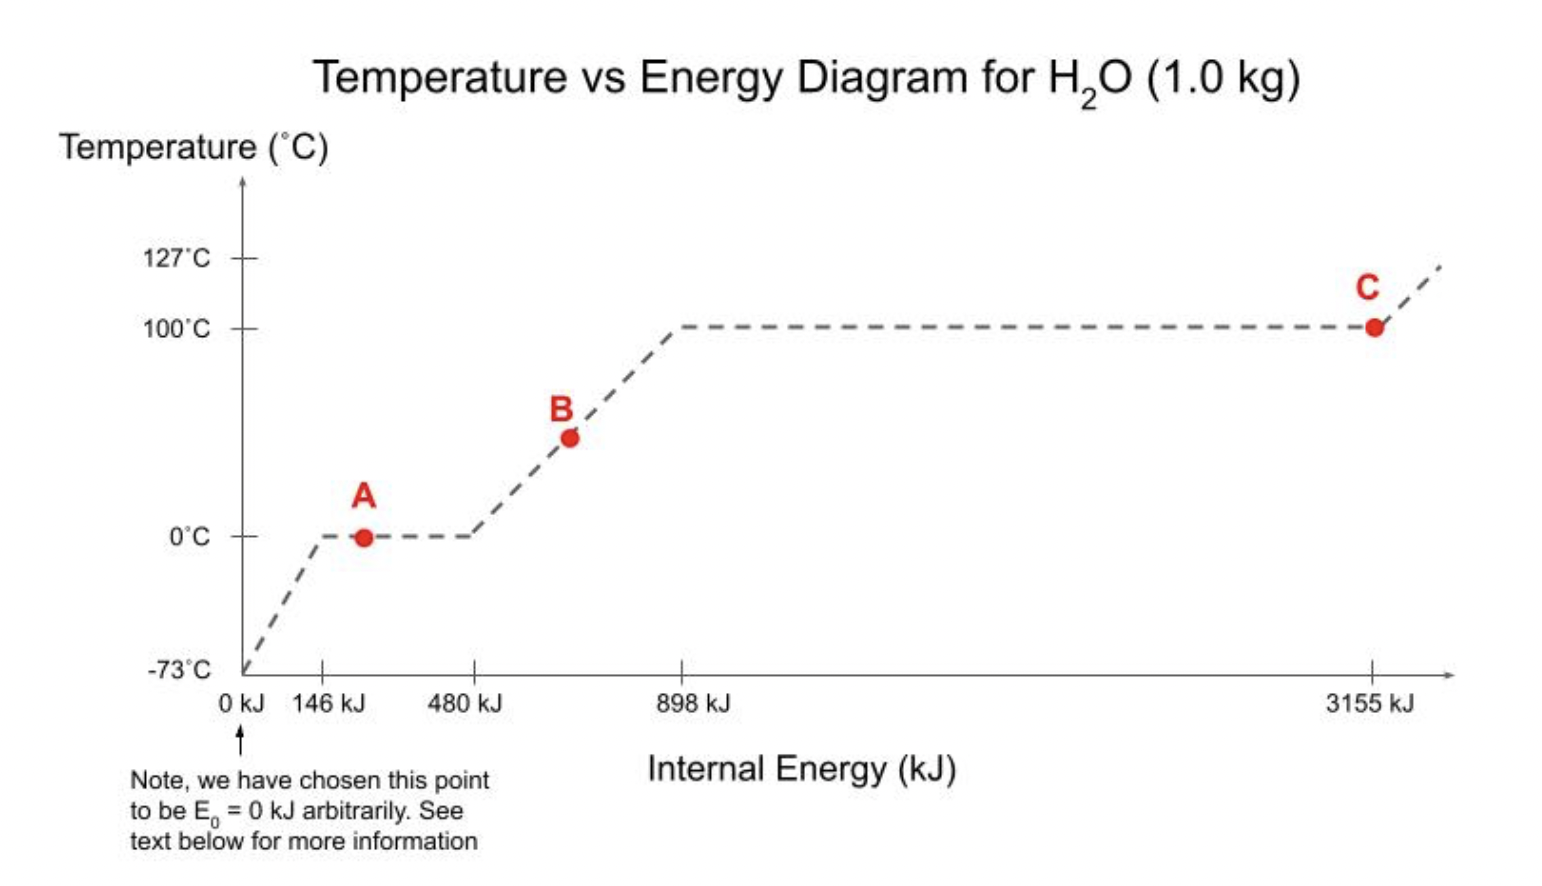
values along the \( x \)-axis (146 kJ, \( 480 \mathrm{~kJ} \), etc.) are the amounts of energy that must be added to get the 1.0kg of water from an itial temperature of \( -73^{\circ} \mathrm{C} \) to the next phase change. For example, \( 480 \mathrm{~kJ} \) is the total amount of energy that must be added to e water starting at the initial temperature of \( -73^{\circ} \mathrm{C} \) to completely melt all the ice. Since we are talking about the amount of lergy added, let's make life easy and make \( -73^{\circ} \mathrm{C} \) where we put \( 0 \mathrm{~kJ} \). (a) Describe what is happening at each of the "corners" on the graph. Also, what phase is the water in at the letter A, B, C? (b) Assume that you have one kilogram of water at an initial temperature of \( -73{ }^{\circ} \mathrm{C} \). If \( 795 \mathrm{~kJ} \) of energy is added, describe the final state (approximate temperature and phase) of the water. If the water is in a mixed phase, determine very approximately the percent in each phase. You are not expected to do any calculations at this time. Simply tell us what the diagram tells you (and how you know that it does). (c) Repeat Part b but with \( 146 \mathrm{~kJ} \) of energy added to the water initially at \( -73{ }^{\circ} \mathrm{C} \). (d) Repeat Part b but with \( 1650 \mathrm{~kJ} \) of energy added to the water initially at \( -73{ }^{\circ} \mathrm{C} \). (e) State the initial and final conditions of the process that takes the system from Point \( \mathrm{C} \) to Point \( \mathrm{B} \) and determine very approximately how much energy would have to be added or removed. (f) Repeat Part e for water initially in State \( A \) and ending in State C. Temperature vs Energy Diagram for \( \mathrm{H}_{2} \mathrm{O}(1.0 \mathrm{~kg}) \)
Expert Answer
A) At first we are at -73?C Point A represents ice liquid equilibrium at 0?C Point B represents when we are heating the liquid its temperature rises. Point C is at liquid vapour equilibrium. This is the last point where liquid exists B) If we are add