Home /
Expert Answers /
Statistics and Probability /
which-of-the-following-scales-uses-a-number-line-fish-scale-ordinal-scale-interval-ratio-scale-nom-pa849
(Solved): Which of the following scales uses a number line? Fish Scale Ordinal Scale Interval/Ratio Scale Nom ...
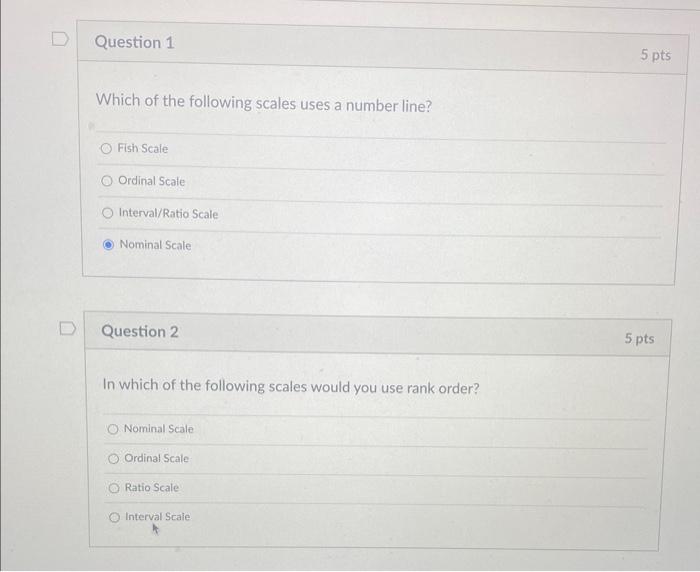
Which of the following scales uses a number line? Fish Scale Ordinal Scale Interval/Ratio Scale Nominal Scale Question 2 In which of the following scales would you use rank order? Nominal Scale Ordinal Scale Ratio Scale Interval Scale
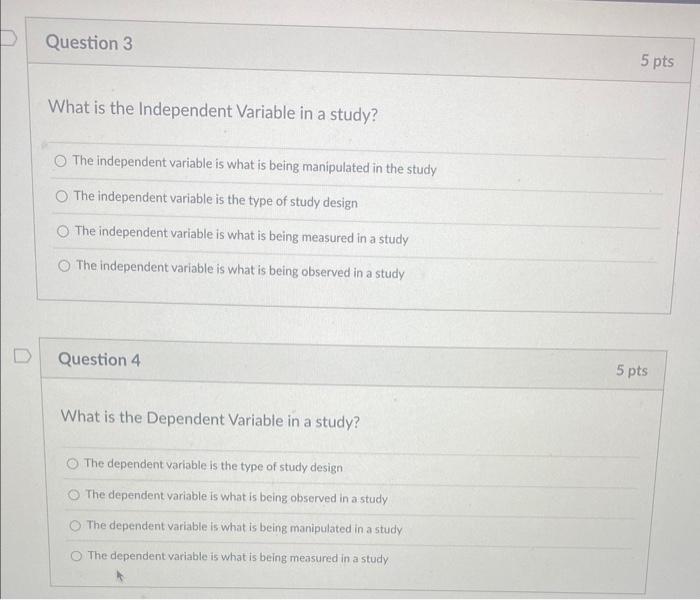
What is the Independent Variable in a study? The independent variable is what is being manipulated in the study The independent variable is the type of study design The independent variable is what is being measured in a study The independent variable is what is being observed in a study Question 4 What is the Dependent Variable in a study? The dependent variable is the type of study design The dependent variable is what is being observed in a study The dependent variable is what is being manipulated in a study The dependent variable is what is being measured in a study
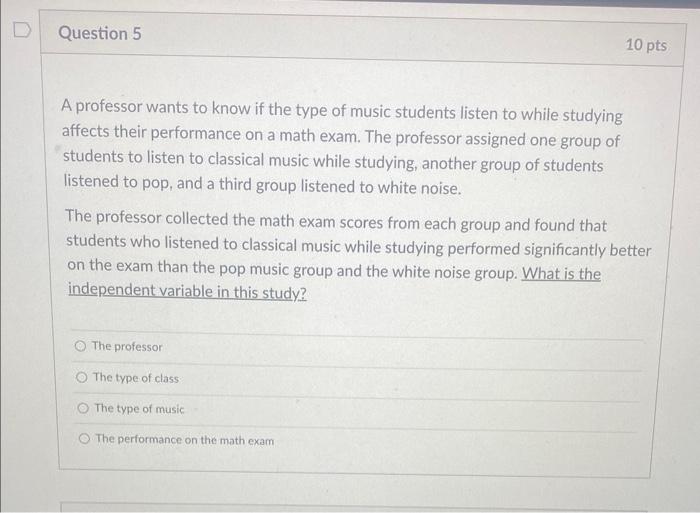
A professor wants to know if the type of music students listen to while studying affects their performance on a math exam. The professor assigned one group of students to listen to classical music while studying, another group of students listened to pop, and a third group listened to white noise. The professor collected the math exam scores from each group and found that students who listened to classical music while studying performed significantly better on the exam than the pop music group and the white noise group. What is the independent variable in this study? The professor The type of class The type of music The performance on the math exam
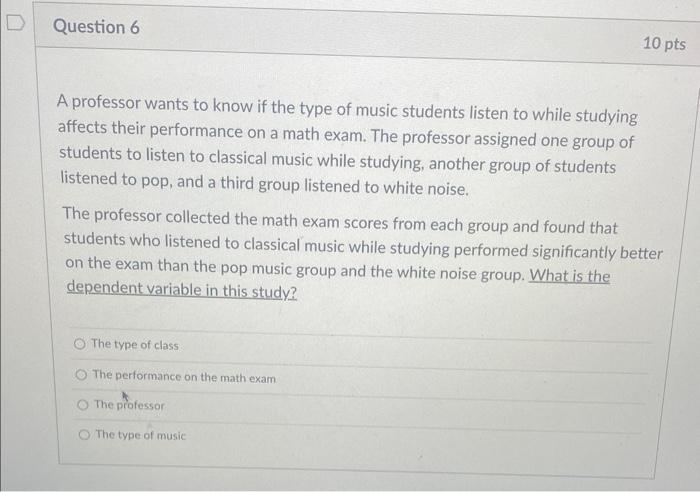
A professor wants to know if the type of music students listen to while studying affects their performance on a math exam. The professor assigned one group of students to listen to classical music while studying, another group of students listened to pop, and a third group listened to white noise. The professor collected the math exam scores from each group and found that students who listened to classical music while studying performed significantly better on the exam than the pop music group and the white noise group. What is the dependent variable in this study? The type of class The performance on the math exam The professor The type of music
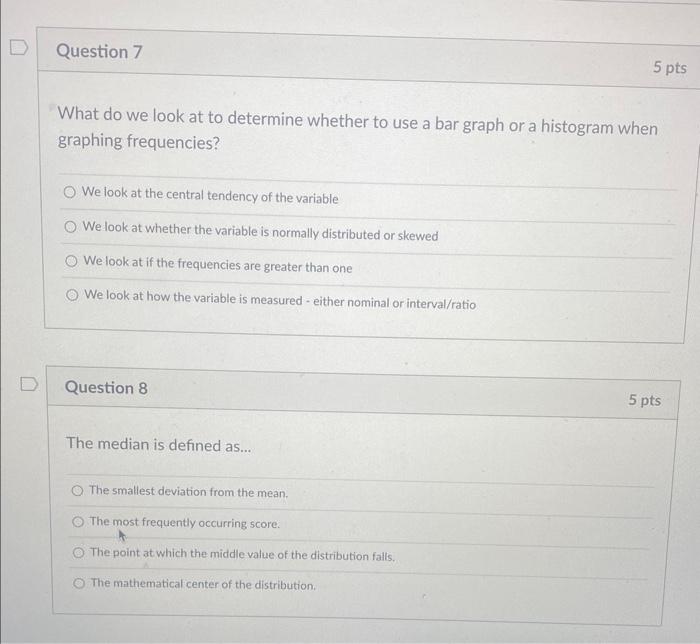
What do we look at to determine whether to use a bar graph or a histogram when graphing frequencies? We look at the central tendency of the variable We look at whether the variable is normally distributed or skewed We look at if the frequencies are greater than one We look at how the variable is measured - either nominal or interval/ratio Question 8 The median is defined as... The smallest deviation from the mean. The most frequently occurring score. The point at which the middle value of the distribution falls. The mathematical center of the distribution.
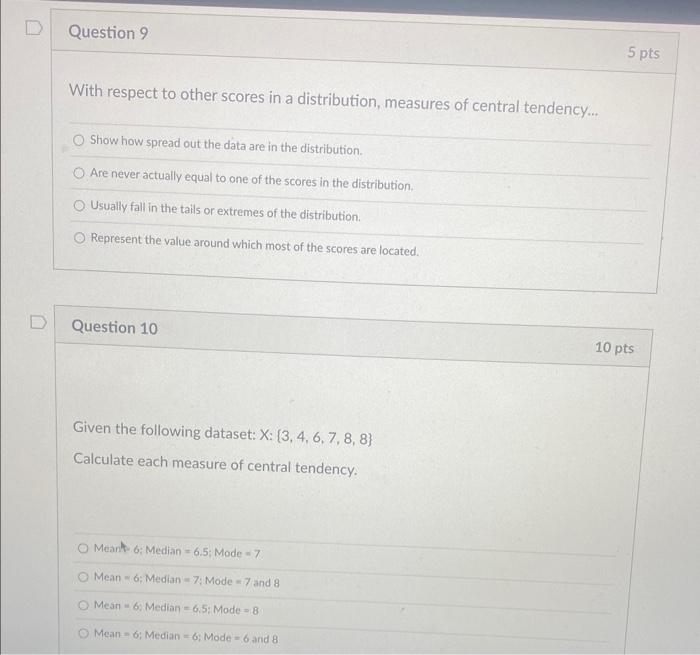
With respect to other scores in a distribution, measures of central tendency... Show how spread out the data are in the distribution. Are never actually equal to one of the scores in the distribution. Usually fall in the tails or extremes of the distribution. Represent the value around which most of the scores are located. Question 10 Given the following dataset: Calculate each measure of central tendency. Meant Median Mode Mean Median Mode and 8 Mean = 6: Median Mode Mean- Median Mode and 8
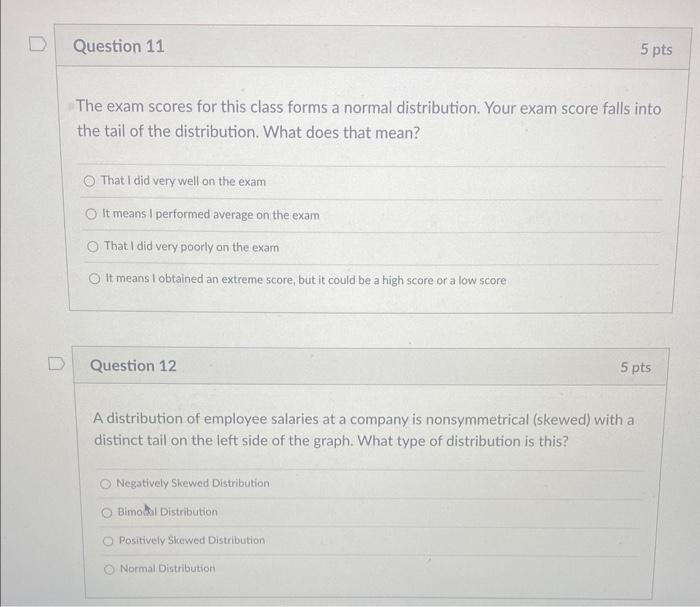
The exam scores for this class forms a normal distribution. Your exam score falls into the tail of the distribution. What does that mean? That I did very well on the exam It means I performed average on the exam That I did very poorly on the exam It means I obtained an extreme score, but it could be a high score or a low score Question 12 A distribution of employee salaries at a company is nonsymmetrical (skewed) with a distinct tail on the left side of the graph. What type of distribution is this? Negatively Skewed Distribution Bimosal Distribution Positively Slcewed Distribution Normal Distribution
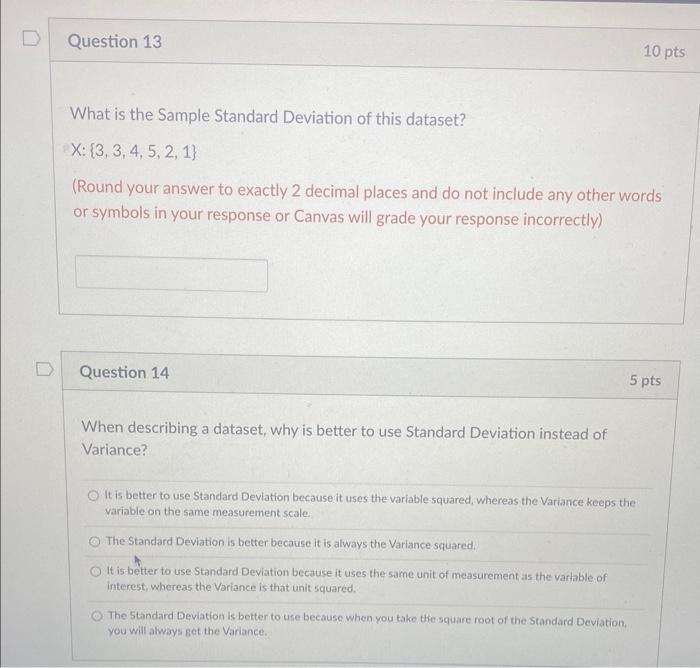
What is the Sample Standard Deviation of this dataset? (Round your answer to exactly 2 decimal places and do not include any other words or symbols in your response or Canvas will grade your response incorrectly) Question 14 When describing a dataset, why is better to use Standard Deviation instead of Variance? It is better to use Standard Deviation because it uses the variable squared, whereas the Variance keeps the variable on the same measurement scale. The Standard Deviation is better because it is always the Variance squared. It is better to use Standard Deviation because it uses the same unit of measurement as the variable of interest, whereas the Variance is that unit squared. The Standard Deviation is better to use because when you take the square root of the Standard Deviation, you will always get the Variance.
When we refer to a score's deviation, we are referring to... How far it is from the other scores How much error occurred in measuring it How close it is to the other scores How far it is from the mean Question 16 Which of the following datasets has the largest variance? (no calculations are necessary) 2, 4. 7, 12, 15, 24,36